When you wanted to know degrees of satisfaction in the past, you got only vague feedback. Now with the Slider, it is not only easier to quantify respondent opinions, but also easier for respondents to intuitively express their feelings in a numerical way. Other than the basic functions shared by all question types: Required, Note, Image/Video, Invisible, Timer, Indent and Style, Range of digits can be set to put more limits on answers so that the input format fits your needs.
Let's say you want customers in a restaurant to rate the overall ambiance of the environment.
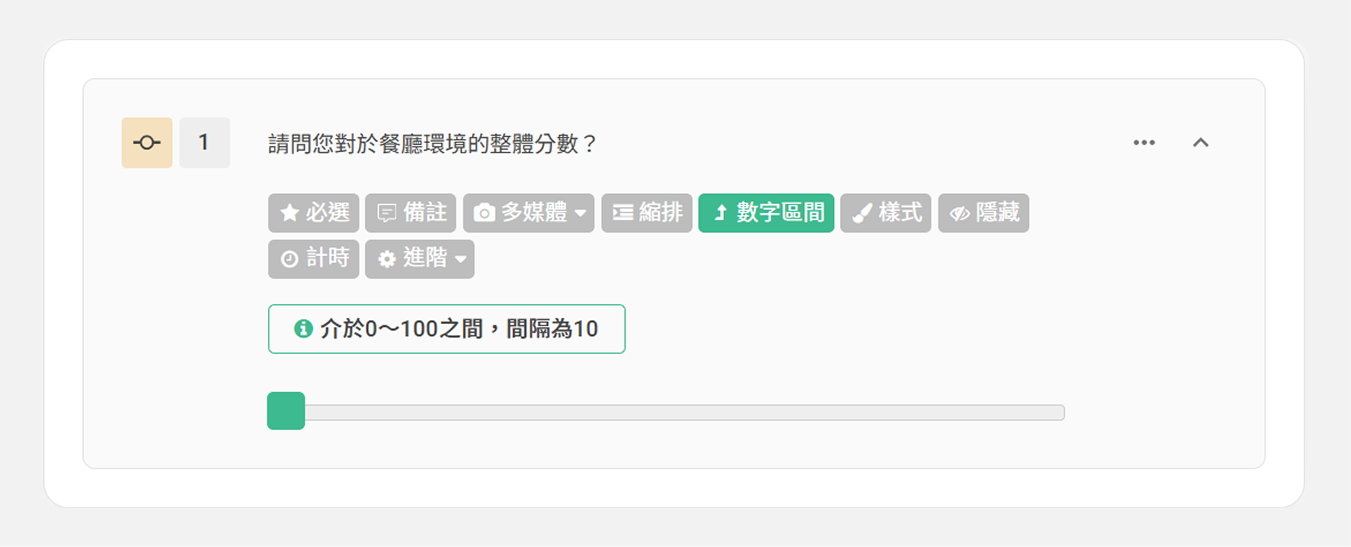
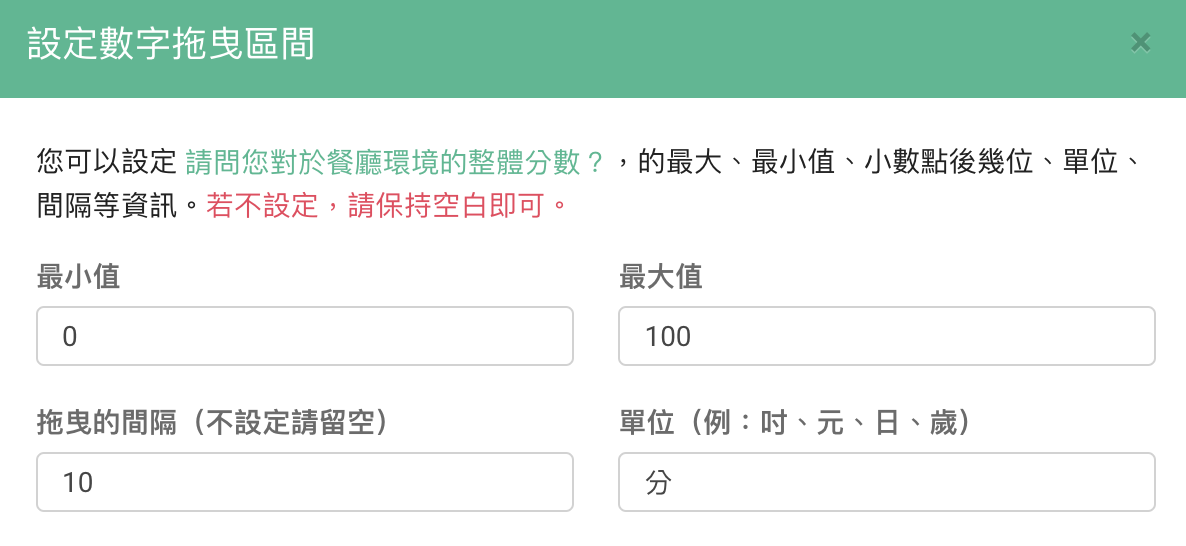
If you think the range of 1-100 is too large, you can modify this by using Range of digits to narrow it down. You can also customize the interval of the numbers to help respondents get a better understanding of what the numbers represent.
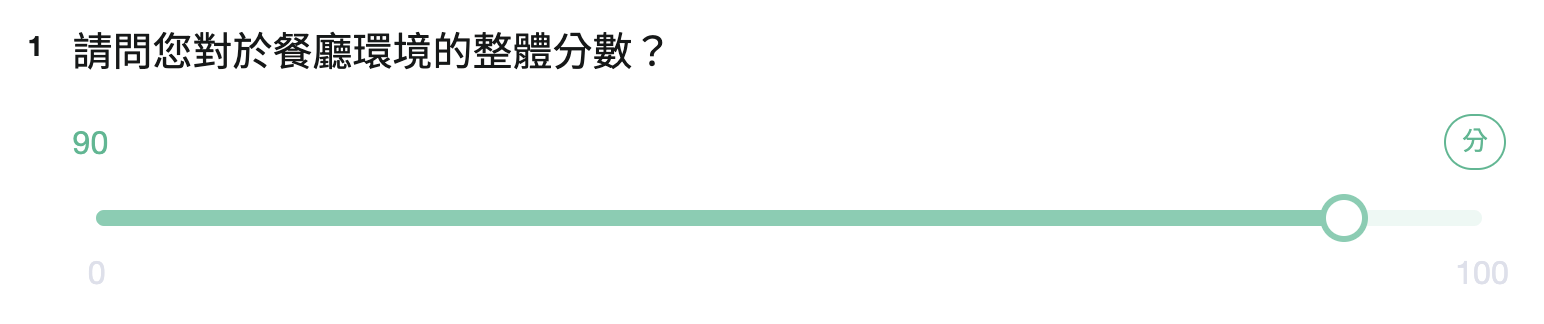
Respondents are able to quantify their abstract opinions and feelings via the numeric Slider.
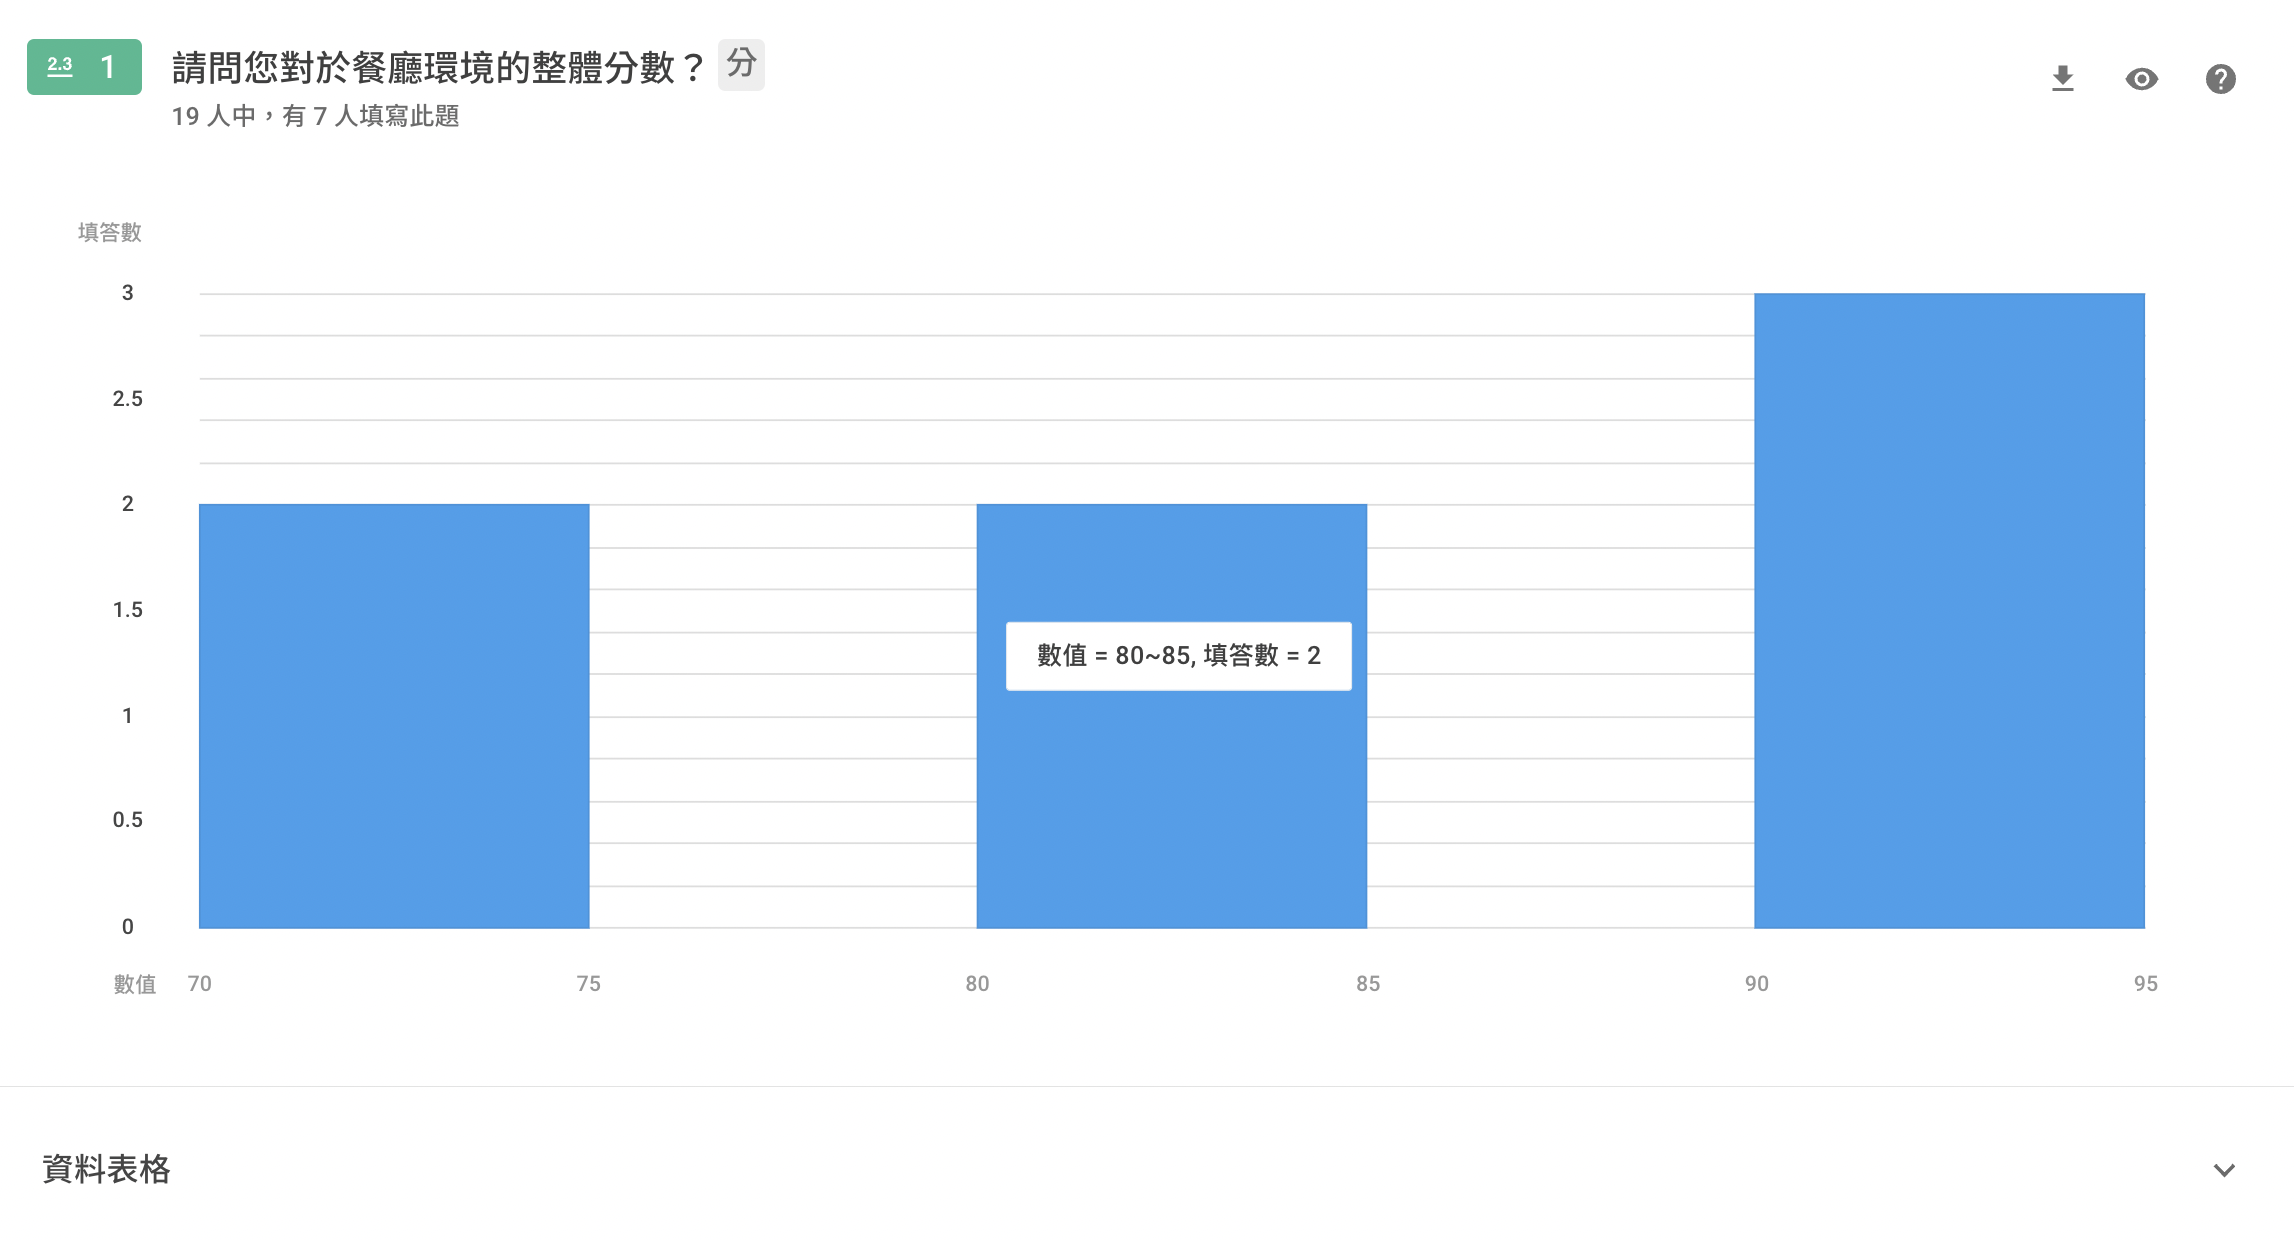
The bar chart of the results can be found in the backend management system. When hovering your pointer over the chart, more detailed response information will be shown.
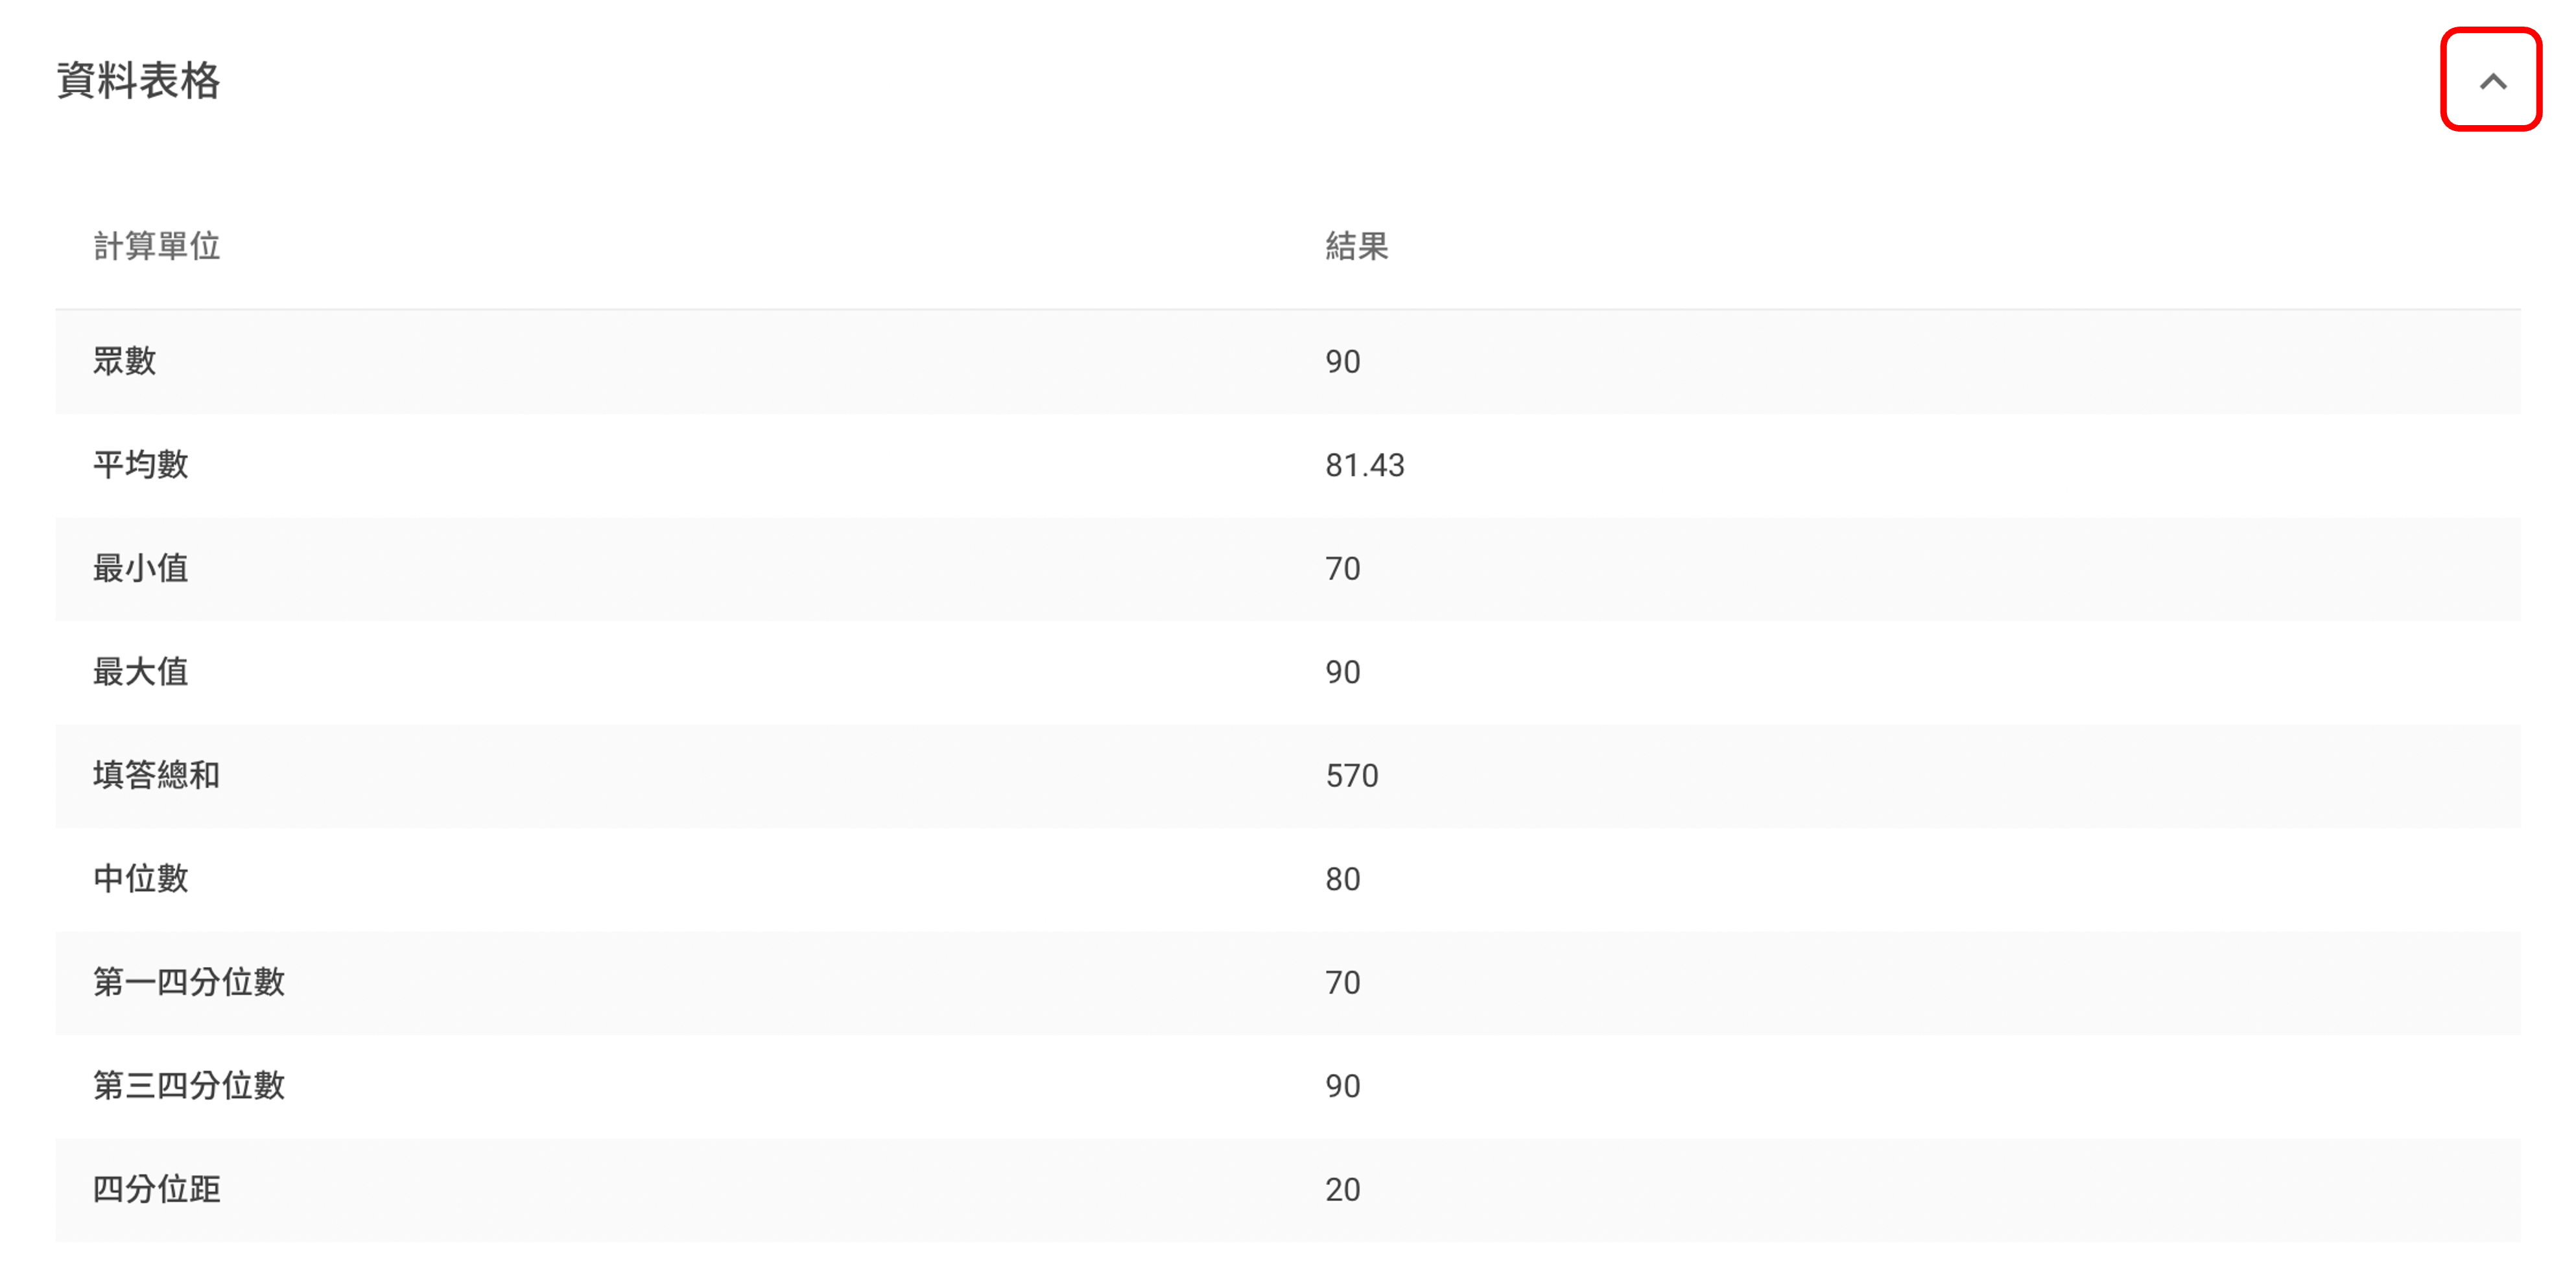
In addition, if you click on the collapsible icon to the right of Breakdown Table, it will also display various calculation results of the response data (e.g. mean, median, etc).
FAQ
What's the biggest difference between Slider and Rating?
First of all, Slider and Rating are commonly used in various satisfaction surveys, mainly to make it easier for respondents to rate.
The main difference between these two types of functions lies in the way they are presented and the experience they provide to the respondents.
Here is a table to illustrate the differences between the two functions :
Summary
Slider helps quantify the feelings and opinions of respondents. It works well with Range of digits to configure both the range and interval of measurement for responses.